These are a few of the Features you'll find in
FlightLog Analyzer 2020 / 2024
Each display has multiple configuration options, of which just a few examples are shown here
Main Display
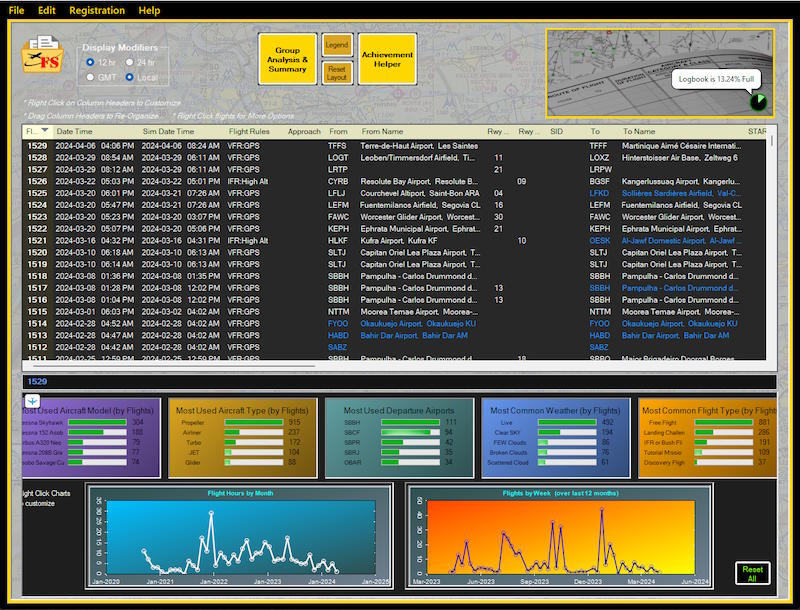
FlightLog Analyzer displays flight information detailing each flight you've made. The flights are pulled directly from Flight Simulator's Logbook.
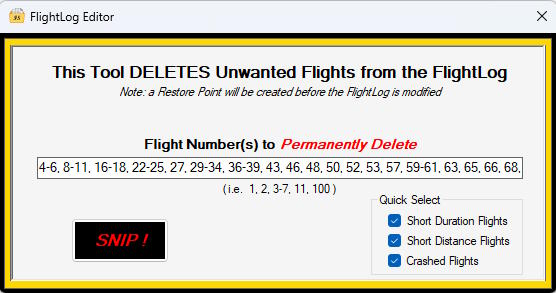
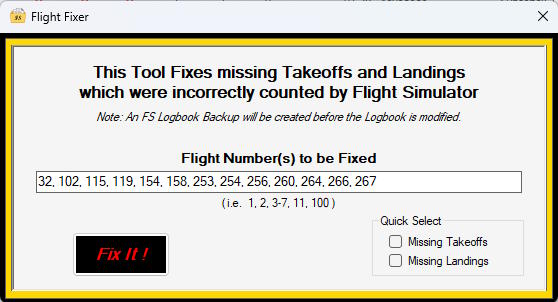
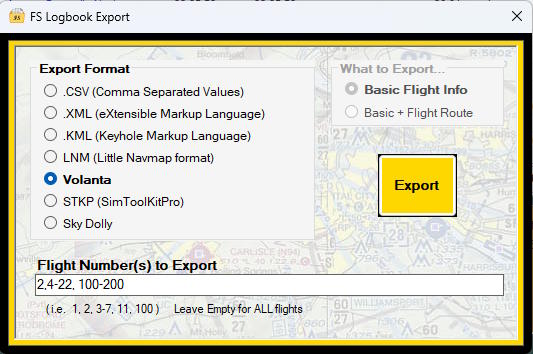
From the Main Display, you'll have the option to Summarize, Graph, Export, Edit and Fix your Flight Simulator Logbook.
* Consolidate your FS2020 and FS2024 flights into a single view.
* Filter the view of flights by multiple criteria. As an example, show only 'Flights from Particular Airports', 'Flights in Particular Aircraft', or 'Flight in Particular Weather'.
* Display flight time in either 12 hour or 24 hour format, as well as Local Time or GMT.
* Logbook columns are Sortable, and can be Re-ordered to suit your needs.
* Pie Charts shows 'Percent of Logbook Capacity' currently being used.
* Charts & Graphs show visual statistics about your flights.
Dark Mode
A 'Dark Mode' feature is supported by FlightLog Analyzer, making it perfect for working in low-light environments.
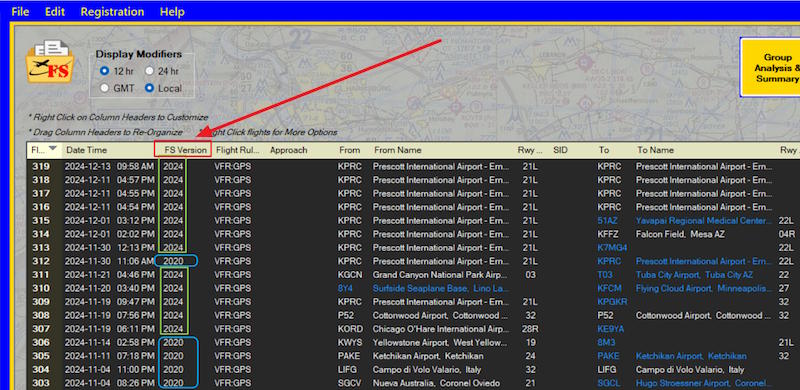
Seamless Consolidation of FS2020 and FS2024 Flights
FlightLog Analyzer provides an integrated and seamless overview of your FS2020 AND FS2024 flight data, all on one display.
The Group Summary and Analysis feature can then process statistic 'by FS Version'.
Flight Map Viewer
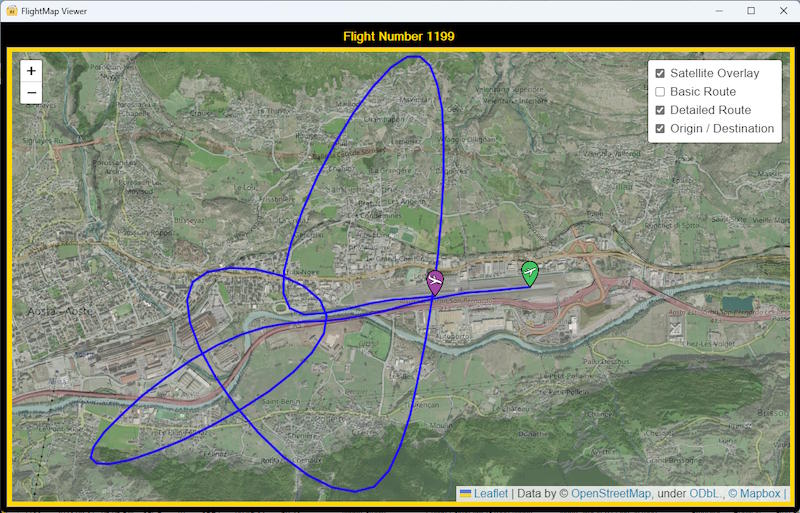
The FlightMap Viewer feature in FlightLog Analyzer has the ability to display the Path of your Flights in Graphical form.
This example shows the Flight Path using the Built-In viewer.
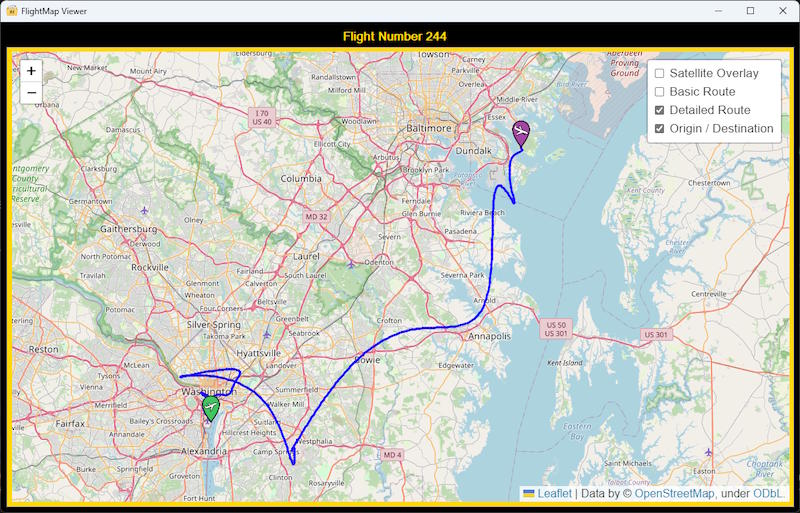
* Attributes such as Map Type can be controlled via Option Selections on the display.
This image shows an example of the Satellite-Overlay map view.
Flights can be displayed on Standard Maps that don't use satellite overlays as well, showing roads and cities.
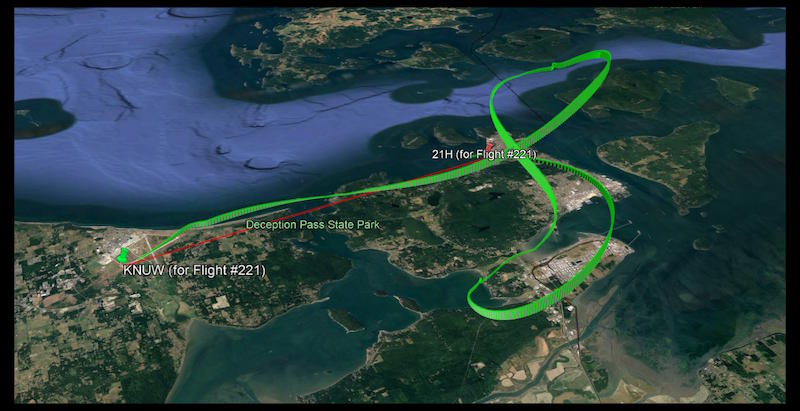
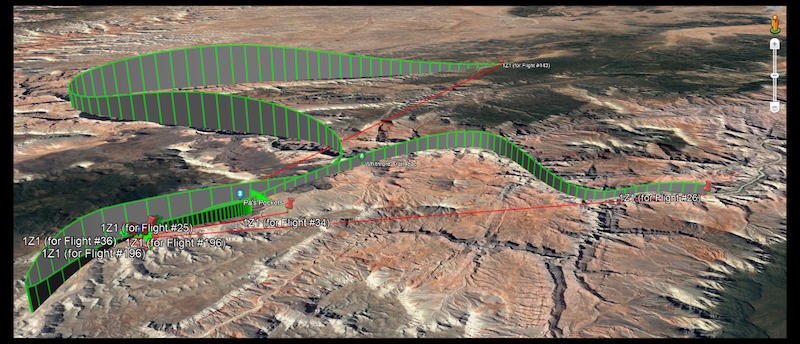
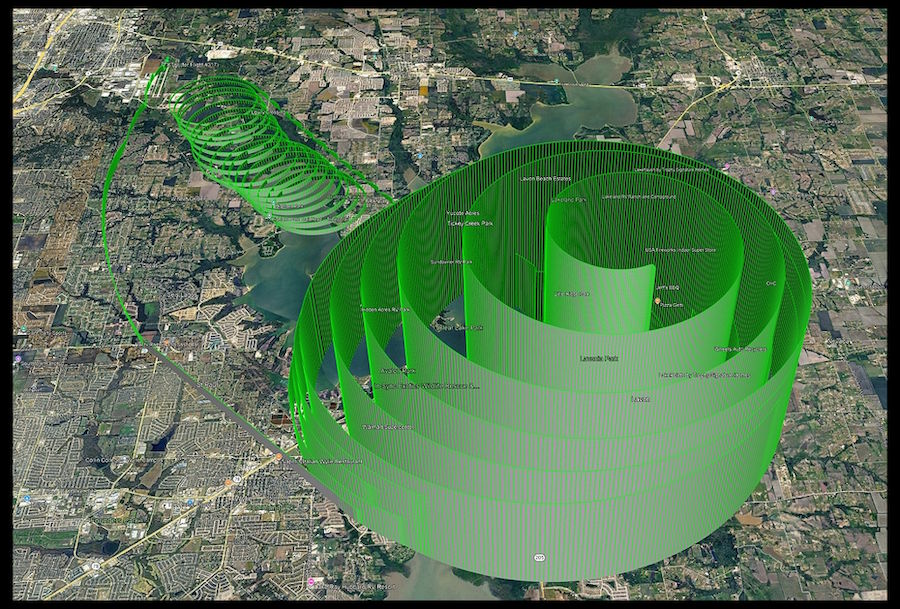
As well as using the Built-In FightMap Viewer, an external "KML Viewer" can be used to display the path of your flights.
Google Earth® is an example of a popular KML Viewer that will integrate seamlessly with FlightLog Analyzer.
As well as using the Built-In FightMap Viewer, an external "KML Viewer" can be used to display the path of your flights.
Google Earth® is an example of a popular KML Viewer that will integrate seamlessly with FlightLog Analyzer.
Another example of maps created with Google Earth® integration.
* for seamless integration, the Google Earth® app needs to be installed separately on your system. It is not part of FlightLog Analyzer.
(even without seamless integration, a KML Export can be imported onto the Web Browser version of Google Earth)
Google Earth® integration let's you rotate / zoom the map to see your route from any perspective,
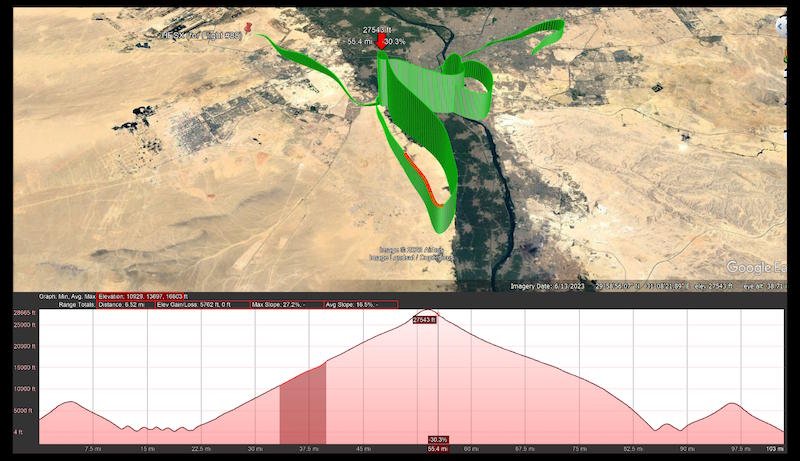
This example of Google Earth® integration shows how the Altitude Profile can be displayed along with the Flight Path.
Flight Profile Viewer
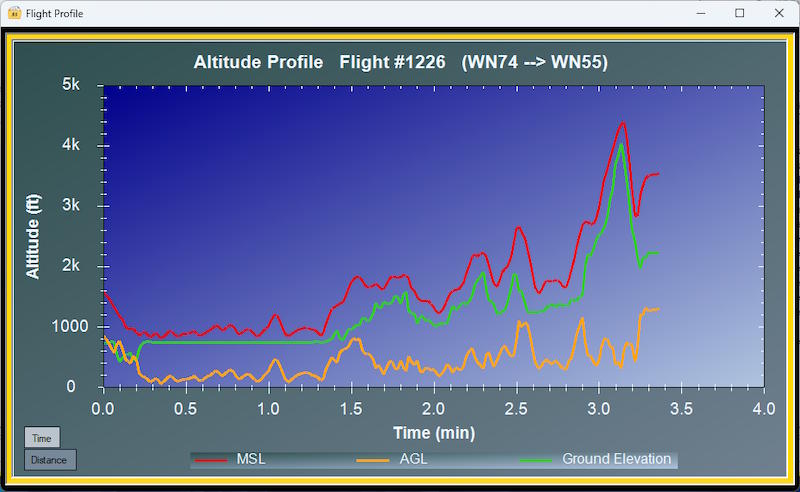
The Flight Profile Viewer displays the Altitude Profile of your flights in Graphical form.
Flight Altitudes can be plotted against either Flight Time or Flight Distance.
The Flight Profile Viewer displays the Altitude Profile of your flights in Graphical form.
Flight Altitudes can be plotted against either Flight Time or Flight Distance.
Altitudes are shown in:
- MSL Altitude (Mean Sea Level)
- AGL Altitude (Above Ground Level)
- and the Ground Elevation
Flight Profile (with True Airspeed)
When Flight Simulator's SimConnect Telemetry has been collected for the flight, True Airspeed is also included on the Altitude Plot.
When Flight Simulator's SimConnect Telemetry has been collected for the flight, True Airspeed is also included on the Altitude Plot.
Achievements Progress Tracker
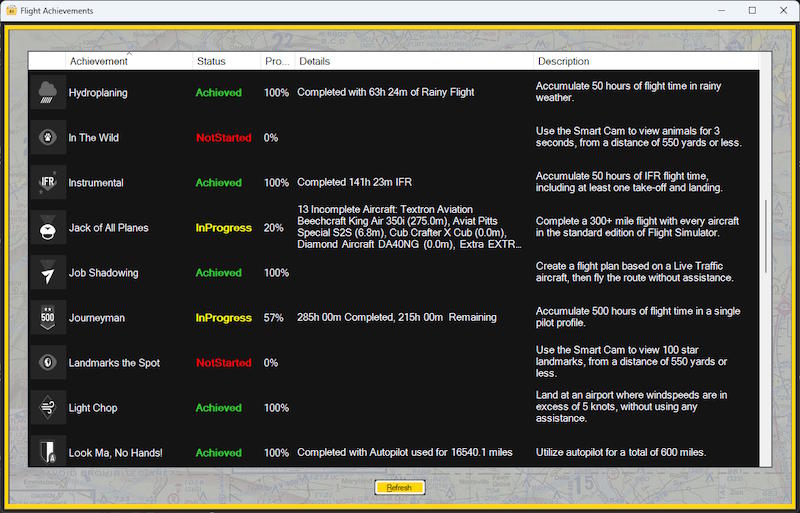
The Achievements Progress Tracker provides comprehensive assistance in evaluating outstanding objectives necessary to complete your 'FS Achievements'.
Achievements are broken down into 'What Has Been Completed' vs 'What Needs to be Completed'.
Group Analysis & Summaries
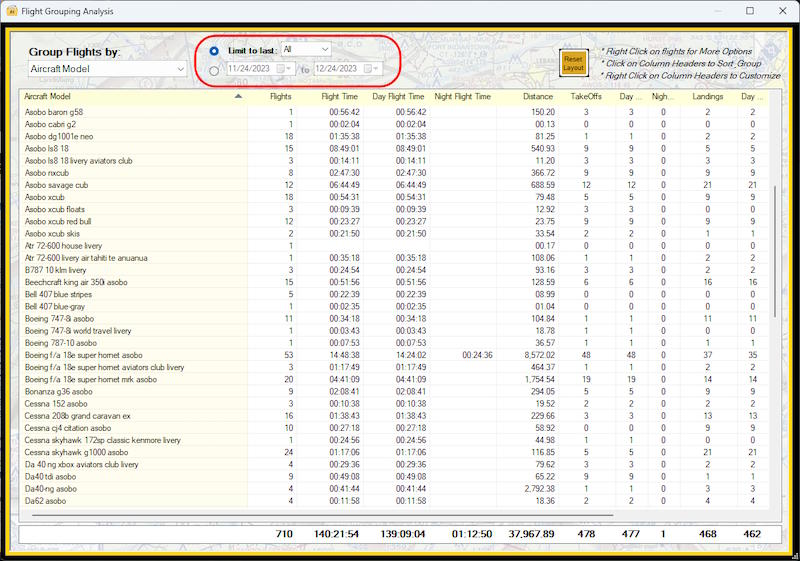
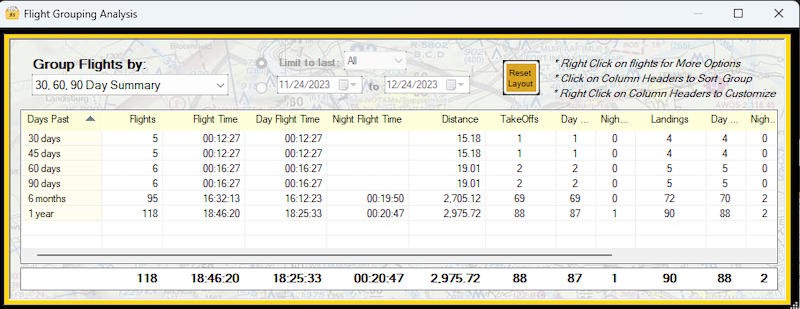
Flight Group Analysis allows flights to be Categorized and Summarized by various Flight Attributes.
Shown here, flights are summarized by "Aircraft Model".
* Analysis is performed across the consolidated flights of both FS2020 and FS2024
* The Analysis Date Window can be filtered by "Limit to last:" days or by specifying a Date Range
Examples of these Summary Flight Attributes include:
- 30, 60, 90 Day Summaries
- Aircraft Type
- Aircraft Model
- Weather Conditions
- Type of Flight ( Discovery, Free Flight, Tutorial Missions, Landing Challenges, etc )
- Flight End Status ( Success, Crash, Unsuccessful Mission, Incomplete, etc)
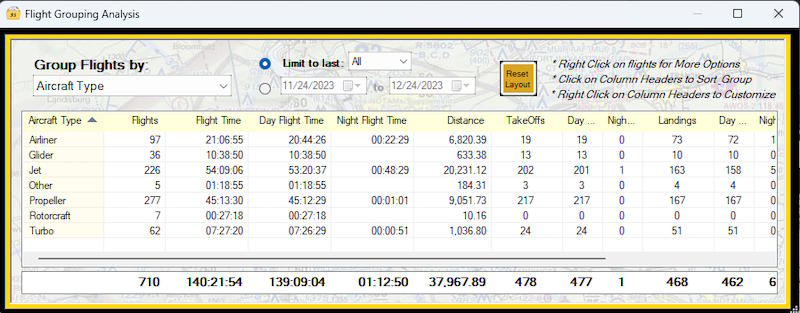
Flights summarized by Aircraft Types.
This provides a breakdown of how many flights, how much flight time, how many Takeoffs and Landings, etc for each 'Type' of aircraft.
Flights summarized by a 30 / 60 / 90 day sliding window.
Flight data is broken down by the number of days in the past.

